Status quo of China’s textile machinery industry, Jan. - Sept., 2018
Mar 06, 2019 | by Flora
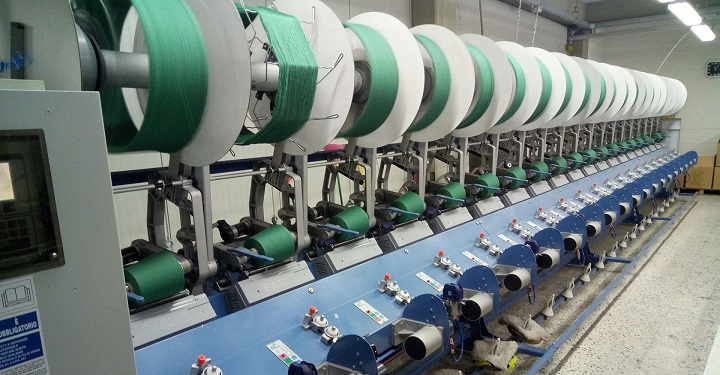
According to the statistic report from China Textile Machinery Association, in the first three quarters of 2018, under the support of the overall smooth operation of the macro economy and the textile industry, the industrial upgrading of the textile machinery industry was further advanced. The overall operation quality was good and maintained a growth trend. The main business income and export market maintained a double-digit growth, while the growth rate of the industry has slowed down.
Economic benefits
Industry scale
In the first three quarters of 2018, the textile machinery industry achieved a main business income of 77.634 billion yuan, an increase of 12.11% year-on-year. The growth rate decreased by 0.82 percentage point compared with the same period of the previous year, which was 3.91 percentage points slower than the first half of 2018. The total assets were 101.913 billion with a year-on-year increased by 8.39%, down by 0.80 percentage point from the same period of the previous year.
Cost structure
In the first three quarters of 2018, the total cost of the textile machinery industry was 72.607 billion yuan, a year-on-year increase of 12.20%. Specifically, the main business cost increased 12.53% to 65.056 billion yuan, accounting for 89.60% of the total. The operating expenses grew 13.87% to 2.411 billion yuan, accounting for 3.32% of the total. The administrative expenses increased 11.35% to 4.531 billion yuan, accounting for 6.24% of the total. The financial expenses decreased 14.11% to 609 million yuan, accounting for 0.84% of the total.
Benefits
In the first three quarters of 2018, the total profit of the textile machinery industry was 5.335 billion yuan, a year-on-year increase of 9.44%. The growth rate slowed down by 10.12 percentage points compared with the first half of the year; the loss of loss-making enterprises was 263.8 million yuan, down by 17.70% year-on-year; the percentage of the posses reached 15.11%. The profit margin of the main business of the textile machinery industry was 8.20%, an increase of 1.05 percentage points over the same period of the previous year. With the development of new products in the textile machinery industry, the continuous improvement of product quality and the effective implementation of control costs, the quality and efficiency of the industry has improved year by year. However, since the third quarter, due to the slowdown in market demand, the growth rate of industry profits has slowed down.
Operation of key enterprises
In the first three quarters of 2018, the survey data from China Textile Machinery Association to the key enterprise showed that the main business income was 36.415 billion yuan, a year-on-year increase of 10.98, accounting for 46.91% of the textile machinery industry; the total profit was 4.523 billion yuan. Among them, the loss of loss-making enterprises was 41 million yuan, a year-on-year increase of 63.10%; the scale of losses was 21.74%, which was 0.71% narrower than the first quarter. The total period expenses of key enterprises was 6.184 billion yuan, a decrease of 1.53% year on year; of which the operating expenses were 1.263 billion yuan, an increase of 1.43% year on year, accounting for 20.42% of the total period expenses; the administrative expenses were 4.018 billion yuan, a decrease of 1.822%, accounting for 64.98% of the total period expenses; the financial expenses were 923 million yuan, a year-on-year decrease of 4.18%, accounting for 14.60% of the total period expenses.
Questionnaire survey of the operation of key enterprises
In order to have a better understanding of the performance of the textile machinery industry in the first three quarters of 2018 and the development trend in 2019, China Textile Machinery Association conducted a questionnaire survey on 372 mainframe and equipment manufacturers, covering spinning machinery, weaving and weaving preparation machinery, knitting machinery, dyeing and printing machinery, chemical fiber and non-woven machinery. According to the nature of the enterprise, private enterprises accounted for 80.71%, state-owned enterprises for 4.62%, collective enterprises for 2.45%, Hong Kong, Macao and Taiwan enterprises for 6.52%, overseas-funded enterprises for 3.53%, others for 2.17%; According to the scale of the enterprise, large enterprises accounted for 9.2%, medium-sized enterprises for 51.12%, small enterprises for 31.80%, and micro-enterprises for 7.26%.
-
Orders of enterprises in the first three quarters of 2018
In the first three quarters of 2018, more than half of enterprises enjoyed increased orders in different degrees, among which, 37.40% enterprises saw an increase of over 10%, 25.75% witnessed a growth within 10%, and 37.87% were the same as the previous year. Enterprises with reduced orders accounted for 10.84%.
In terms of overseas orders, 26.33% of enterprises increased by more than 10%, 24.26% grew by within 10%, 37.87% were flat compared with the same period of the previous year, and enterprises that reduced by less than 10% and reduced by more than 10% accounted for 7.99% and 3.55% respectively.
-
Forecast of orders for the fourth quarter of 2018
For the expectation of order demand in the fourth quarter of 2018, 52.49% of the enterprises are expected to grow, which is lower than the 63.15% increase in orders in the first three quarters. It can be seen that the companies ares more cautious in the fourth quarter. 32.84% companies are expected to be flat with the previous three quarters, while 14.37% are to see decreased orders in the fourth quarter. n terms of overseas orders, 43.79% of the companies are expected to grow in the fourth quarter, 45.34% are expected to be flat with the first three quarters, and 10.87% are expected to see order decrease.
-
Average ex-factory prices of major products
In the first three quarters of 2018, 17.86% companies witnessed main product sales prices increase by more than 5% year-on-year, 22.25% increased within 5%, and 41.48% was flat compared to the same period of the previous year. 18.41% presented declined prices.
-
Product inventory
In the first three quarters of 2018, the companies were faced with relatively high product inventory pressures, for 80.94% saw increased or the same inventory compared to the previous year. 10.50% enterprises increased by more than 10%, 15.75% within 10%, 54.70% were the same as that of the same period of the previous year. Enterprises that saw reduced inventory by less than 10% and more than 10% accounted for 14.92% and 4.14% respectively.
-
Enterprise equipment utilization
In the first three quarters of 2018, among the surveyed enterprises, 60.11% presented equipment utilization rate above 80%, while that between 50% and 80% accounted for 33.62%, and that less than 50% accounted for 5.98%. Overall, the equipment utilization rate of large and medium-sized enterprises is better than that of small and micro enterprises.
-
Major problems encountered in the production and operation of enterprises
Among the enterprises surveyed, the primary problem lies in the volatility of raw material prices, disorder and poor price competition. In addition, the lack of employment due to difficulties in recruitment, insufficient domestic market demand, and rising inflation-driven costs are also common problems.
-
Anticipation of business operations and industry judgments
58.70% of the companies surveyed believe that the operating income will increase in 2018, but only 45.13% of enterprises have the same attitude towards the operating income in 2019; 29.97% believe that 2018 operating income will be the same as the previous year, for 2019 this figure is expected to grow to 37.76%, and 11.50% of companies believe that the operating income in 2018 is lower than the previous year. Among the companies surveyed, 43.07% of the companies expressed optimism about the industry in 2018. The company’s judgment on the situation of 2019 is much more cautious in terms of business revenue and industry.
Imports and exports
According to Customs statistics, the total import and export of China’s textile machinery in the first three quarters of 2018 was 5,531 million US dollars, a year-on-year increase of 12.70%. Among them: textile machinery exports were 2.78 billion US dollars, an increase of 16.96%; imports were 2.751 billion US dollars, an increase of 8.70%. The export growth rate is greater than the import growth rate. Since February, the textile machinery industry has turned into a surplus. Table 1 reflects the import and export of China’s textile machinery.
Table 1 Total Imports and Exports of China’s Textile Machinery, Jan. - Sept., 2018
(Unit: USD)
|
|
Total Value |
Y/Y Value (%) |
|
Total Imports and Exports |
5,531,379,835 |
12.70 |
|
Of them: Imports |
2,751,050,575 |
8.70 |
|
Exports |
2,780,329,260 |
16.96 |
Imports
In the first three quarters of 2018, textile machinery was imported from 64 countries and regions, with a total import value of 2.751 billion US dollars, an increase of 8.70% year on year.
-
Imports of textile machinery
From the category of imported products, the import of auxiliary equipment and spare parts ranked first, with a total import value of 695 million US dollars, an increase of 14.81%, accounting for 25.27%; Among the seven major categories of products, five saw increases while two presented decreases; The growth rate of auxiliary equipment and spare parts, chemical fiber machinery and nonwovens machinery is higher than the industry average, as shown in Table 2.
Table 2 Imports of Textile Machinery Products, Jan. - Sept., 2018
(Unit: USD, %)
|
Products |
Total Amount |
Proportion |
Y/Y Value |
|
Total |
2,751,050,575 |
100.00 |
8.70 |
|
Auxiliary equipment and spare parts |
695,087,748 |
25.27 |
14.81 |
|
Chemical fiber machinery |
545,560,324 |
19.83 |
127.16 |
|
Spinning machinery |
510,210,970 |
18.55 |
-6.85 |
|
Weaving machinery |
351,053,735 |
12.76 |
6.07 |
|
Dyeing and finishing machinery |
322,907,193 |
11.74 |
-3.70 |
|
Knitting machinery |
251,864,157 |
9.16 |
-37.96 |
|
Nonwovens machinery |
74,366,448 |
2.70 |
14.04 |
Table 3 Countries and Regions of Various Textile Machinery Imports
(Unit: USD)
|
Chemical fiber machinery |
Country |
Japan |
Germany |
Austria |
Italy |
South Korea |
|
Value |
294,982,513 |
214,349,948 |
11,828,006 |
5,263,074 |
3,752,351 | |
|
Spinning machinery |
Country |
Germany |
Japan |
Italy |
Czech Republic |
France |
|
Value |
222,170,758 |
96,713,064 |
94,296,432 |
27,846,303 |
27,343,022 | |
|
Weaving machinery |
Country |
Japan |
Belgium |
Germany |
Switzerland |
Italy |
|
Value |
157,442,544 |
96,212,850 |
35,337,717 |
28,704,080 |
28,041,468 | |
|
Knitting machinery |
Country |
Japan |
Germany |
Italy |
China Taiwan |
Switzerland |
|
Value |
105,383,795 |
84,860,567 |
41,688,578 |
8,744,421 |
4,634,407 | |
|
Auxiliary equipment and spare parts |
Country |
Germany |
Japan |
Italy |
Switzerland |
France |
|
Value |
256,209,241 |
96,798,461 |
55,492,982 |
48,487,309 |
43,736,603 | |
|
Nonwovens machinery |
Country |
Germany |
France |
Portugal |
Japan |
China Taiwan |
|
Value |
41,882,486 |
11,251,122 |
9,247,768 |
5,093,414 |
3,992,548 | |
|
Dyeing and finishing machinery |
Country |
China Taiwan |
Italy |
Germany |
South Korea |
Japan |
|
Value |
84,091,578 |
66,733,110 |
53,273,209 |
34,861,662 |
32,057,587 |
-
Main countries and regions of textile machinery imports
In the first three quarters of 2018, the major importing countries and regions were mainly Germany, Japan, Italy, China Taiwan, and Belgium. The top five import trade volume was 2.22 billion US dollars, an increase of 8.70% year on year, accounting for 80.71% of the total. (Table 4)
Table 4 Import Overview of Major Countries and Regions, Jan. - Sept., 2018
(Unit: USD)
|
Country or Region |
Total Amount |
Proportion
(%) |
Y/Y Value
(%) |
|
Total |
2,751,050,575 |
100.00 |
8.70 |
|
Germany |
908,083,926 |
33.01 |
27.06 |
|
Japan |
788,471,378 |
28.66 |
3.72 |
|
Italy |
294,847,227 |
10.72 |
-2.32 |
|
China Taiwan |
118,845,888 |
4.32 |
-3.20 |
|
Belgium |
110,213,927 |
4.01 |
-20.71 |
|
Other countries and regions |
530,588,229 |
19.29 |
7.78 |
-
Overview of import regions in China
In the first three quarters of 2018, 29 provinces, municipalities and autonomous regions across the country saw different quantities of imports. Jiangsu, Zhejiang, Guangdong, Shanghai and Xinjiang Uygur Autonomous region ranked among the top five in terms of total imports, accounting for 82.61% of the total. The total import value of Jiangsu Province ranked first in the amount of 877 million US dollars, an increase of 20.67%, accounting for 31.87%. With the development of Xinjiang’s textile industry, its total imports in the first three quarters of 2018 jumped to the fifth place. Table 5 reflects the top five provinces and cities in textile machinery imports.
Table 5 Overview of Top Five Regions in Imports, Jan. - Sept., 2018
(Unit:USD)
|
Province or City |
Total Amount |
Proportion
(%) |
Y/Y Value
(%) |
|
Total |
2,751,050,575 |
100.00 |
8.70 |
|
Jiangsu |
876,644,754 |
31.87 |
20.67 |
|
Zhejiang |
668,339,879 |
24.29 |
50.93 |
|
Guangdong |
302,454,129 |
10.99 |
-31.28 |
|
Shanghai |
230,114,312 |
8.36 |
21.17 |
|
Xinjiang |
195,056,456 |
7.09 |
46.21 |
|
Others |
478,441,045 |
17.39 |
-20.00 |
Exports
In the aspect of overseas market, with the growth of demand in foreign markets such as Southeast Asia, South Asia and Africa as well as the steady enhancement of the international competitiveness of domestic products, the textile machinery industry maintained a double-digit growth rate in 2018. In the first three quarters of 2018, textile machinery exports were 2.78 billion US dollars, an increase of 16.96% year on year. From the Customs data, the growth rate of export value has slowed down month by month in recent months. In addition to the impact of demand in the international market, the higher base in the same period of the previous year is also one of the reasons for the impact.
-
Exports of textile machinery
From January to September 2018, Customs statistics on textile machinery exports are classified as shown in Table 6. The export value of knitting machinery was 728 million US dollars, a decrease of 4.54% year on year, accounting for 26.18%, ranking first, followed by dyeing and finishing machinery, auxiliary equipment and spare parts, spinning machinery, weaving machinery, chemical fiber machinery and nonwovens machinery. The seven major categories of products, except knitting machinery, have achieved double-digit growth. (Table 7)
Table 6 Exports of Textile Machinery Products, Jan. - Sept., 2018
(Unit:USD)
|
Products |
Total Amount |
Proportion
(%) |
Y/Y Value
(%) |
|
Total |
2,780,329,260 |
100.00 |
16.96 |
|
Knitting machinery
|
727,836,654 |
26.18 |
-4.54 |
|
Dyeing and finishing machinery
|
519,272,155 |
18.68 |
18.32 |
|
Auxiliary equipment and spare parts |
504,969,411 |
18.16 |
17.15 |
|
Spinning machinery
|
399,096,661 |
14.35 |
39.22 |
|
Weaving machinery |
314,659,901 |
11.32 |
24.41 |
|
Chemical fiber machinery
|
188,088,506 |
6.76 |
70.78 |
|
Nonwovens machinery |
126,405,972 |
4.55 |
33.07 |
Table 7 Countries and Regions of Various Textile Machinery Exports
(Unit: USD)
|
Chemical fiber machinery |
Country |
Japan |
India |
Vietnam |
Turkey |
Indonesia |
|
Value |
55,184,094 |
18,084,699 |
17,508,163 |
16,690,093 |
13,665,299 | |
|
Spinning machinery |
Country |
Vietnam |
Bangladesh |
India |
Malaysia |
Netherlands |
|
Value |
127,361,615 |
43,786,989 |
38,855,623 |
29,836,997 |
24,039,401 | |
|
Weaving machinery |
Country |
India |
Bangladesh |
Indonesia |
Vietnam |
Uzbekistan |
|
Value |
133,481,784 |
40,984,367 |
29,823,827 |
24,906,727 |
18,574,019 | |
|
Knitting machinery |
Country |
India |
Bangladesh |
Vietnam |
Pakistan |
Turkey |
|
Value |
145,185,018 |
106,776,150 |
92,652,184 |
60,512,574 |
42,101,273 | |
|
Auxiliary equipment and spare parts |
Country |
India |
Japan |
Germany |
Vietnam |
Belgium |
|
Value |
98,123,810 |
54,822,681 |
50,020,255 |
43,701,570 |
24,817,456 | |
|
Nonwovens machinery |
Country |
India |
Vietnam |
Turkey |
South Korea |
Egypt |
|
Value |
20,511,702 |
11,218,328 |
11,196,239 |
9,608,722 |
7,671,073 | |
|
Dyeing and finishing machinery |
Country |
Vietnam |
Bangladesh |
India |
Unite States |
Indonesia |
|
Value |
84,461,815 |
54,402,528 |
40,245,793 |
33,160,570 |
29,532,231 |
-
Main trading partners in exports
In the first nine months of 2018, China’s textile machinery were exported to 180 countries and regions, while the top five export countries and regions are shown in Table 8.
Table 8 Export Overview of Major Countries and Regions, Jan. - Sept., 2018
(Unit:USD)
|
Country or Region |
Total Amount |
Proportion
(%) |
Y/Y Value
(%) |
|
Total amount |
2,780,329,260 |
100.00 |
16.96 |
|
India |
494,488,429 |
17.79 |
-3.62 |
|
Vietnam |
401,810,402 |
14.45 |
52.94 |
|
Bangladesh |
268,779,257 |
9.67 |
15.17 |
|
Indonesia |
146,135,396 |
5.26 |
29.61 |
|
Turkey |
136,521,373 |
4.91 |
93.02 |
|
Other countries and regions |
1,332,594,403 |
47.93 |
12.51 |
In the first three quarters of 2018, exports to the above countries and regions accounted for 52.07% of the total exports.
Table 9 Overview of Exports to the Areas along the Belt and Road
(Unit:USD)
|
|
Total number |
Total Value |
Y/Y Value (%) |
|
Areas along the Belt and Road |
64 |
2,017,419,816 |
18.35 |
|
Proportion |
34.44 |
72.56 |
1.19 |
|
East Asia |
1 |
2,241,557 |
103.98 |
|
ASEAN |
10 |
718,532,896 |
41.73 |
|
West Asia |
18 |
230,247,021 |
25.59 |
|
South Asia |
8 |
901,507,116 |
2.35 |
|
Central Asia |
5 |
96,713,821 |
40.24 |
|
Commonwealth of Independent States |
7 |
43,897,307 |
13.55 |
|
Central and Eastern Europe |
5 |
24,280,098 |
-1.79 |
-
Main trading partners in exports
In the first three quarters of 2018, a total of 29 provinces and autonomous regions presented exports of textile machinery, accounting for 82.37% of the total exports. The details are shown in Table 10 and Table 11.
Table 10 Overview of Top Five Regions in Exports, Jan. - Sept., 2018
(Unit: USD)
|
Province or City |
Total Amount |
Proportion
(%) |
Y/Y Value
(%) |
|
Total |
2780329260 |
100.00 |
16.96 |
|
Jiangsu |
765754825 |
27.54 |
28.60 |
|
Zhejiang |
676646157 |
24.34 |
8.69 |
|
Shanghai |
328962476 |
11.83 |
15.34 |
|
Guangdong |
320460136 |
11.53 |
15.70 |
|
Shandong |
198361550 |
7.13 |
35.41 |
|
Others |
490144116 |
17.63 |
8.82 |
Table 11 Export Details of Main Provinces or Cities, Jan. - Sept., 2018
(Unit: USD)
|
Zhejiang |
Categories |
Knitting machinery
|
Auxiliary equipment and spare parts |
Dyeing and finishing machinery |
Weaving machinery
|
Spinning machinery |
Nonwovens machinery |
Chemical fiber machinery
|
|
Value |
318,589,839 |
89,461,290 |
84,251,568 |
77,594,453 |
49,992,160 |
47,756,095 |
9,000,752 | |
|
Jiangsu |
Categories |
Auxiliary equipment and spare parts |
Spinning machinery |
Knitting machinery
|
Dyeing and finishing machinery |
Chemical fiber machinery
|
Weaving machinery
|
Nonwovens machinery |
|
Value |
197,710,038 |
180,255,471 |
104,152,935 |
101,358,317 |
75,290,965 |
59,865,273 |
47,121,826 | |
|
Shanghai |
Categories |
Auxiliary equipment and spare parts |
Dyeing and finishing machinery |
Knitting machinery |
Chemical fiber machinery |
Spinning machinery |
Weaving machinery
|
Nonwovens machinery |
|
Value |
80,662,897 |
80,055,421 |
63,986,885 |
61,751,213 |
30,333,322 |
8,791,766 |
3,380,972 | |
|
Guangdong |
Categories |
Dyeing and finishing machinery |
Knitting machinery |
Weaving machinery
|
Auxiliary equipment and spare parts |
Spinning machinery |
Nonwovens machinery |
Chemical fiber machinery |
|
Value |
189,070,028 |
75,145,707 |
19,715,171 |
16,012,488 |
10,676,324 |
5,688,558 |
4,151,860 | |
|
Shandong |
Categories |
Weaving machinery
|
Auxiliary equipment and spare parts |
Spinning machinery |
Dyeing and finishing machinery |
Nonwovens machinery |
Knitting machinery |
Chemical fiber machinery |
|
Value |
98,990,576 |
36,646,354 |
34,998,172 |
12,212,359 |
6,031,361 |
5,552,210 |
3,930,518 | |
|
Others |
Categories |
Knitting machinery |
Spinning machinery |
Auxiliary equipment and spare parts |
Dyeing and finishing machinery |
Weaving machinery
|
Chemical fiber machinery |
Nonwovens machinery |
|
Value |
160,409,078 |
92,841,212 |
87,288,496 |
52,324,462 |
49,702,662 |
33,963,198 |
13,615,008 |
Prospects for the industry situation
The development of the textile industry directly affects the market conditions of the textile machinery industry. Since the beginning of 2018, with the differentiation of textile industry demand, the market sales of textile machinery in various sub-sectors were also different. The sales of most of the spinning machinery slowed down, and the weaving machinery maintained a high growth trend in the first half of the year. Since the third quarter, the market has slowed down. The main products of knitting machinery have slowed down in the third quarter, and the dyeing and finishing machinery has maintained a higher degree of prosperity. The sales of chemical fiber machinery has increased significantly in the first three quarters, but new orders will slow down in the fourth quarter. Non-woven machinery has experienced a downward trend in 2018 after experiencing high growth in previous years. From the performance data, the textile machinery industry achieved a steady growth in the first three quarters of 2018, but the growth rate of the operation has slowed down. It is expected that the textile machinery industry will maintain a certain level of growth in 2018.
Looking forward to 2019, influenced by U.S. trade protectionism, although the world’s major economic organizations have lowered their economic growth rates, the world economy will still be on a recovery track, the international market demand will be basically stable, and the general trend of China’s national economic development will not change. Generally speaking, the domestic and international market environment faced by China’s textile industry in 2019 is still basically stable, but external demand faces more uncertainties and various risk factors have increased. Affected by this, the domestic market pressure of the textile machinery industry is bound to increase, and the foreign market is still expected to maintain relatively stable development. Textile machinery enterprises must actively accelerate structural adjustment and technological innovation, and operate steadily to cope with market fluctuations, working together to promote China’s textile machinery industry to achieve high quality development.