Recent price movement
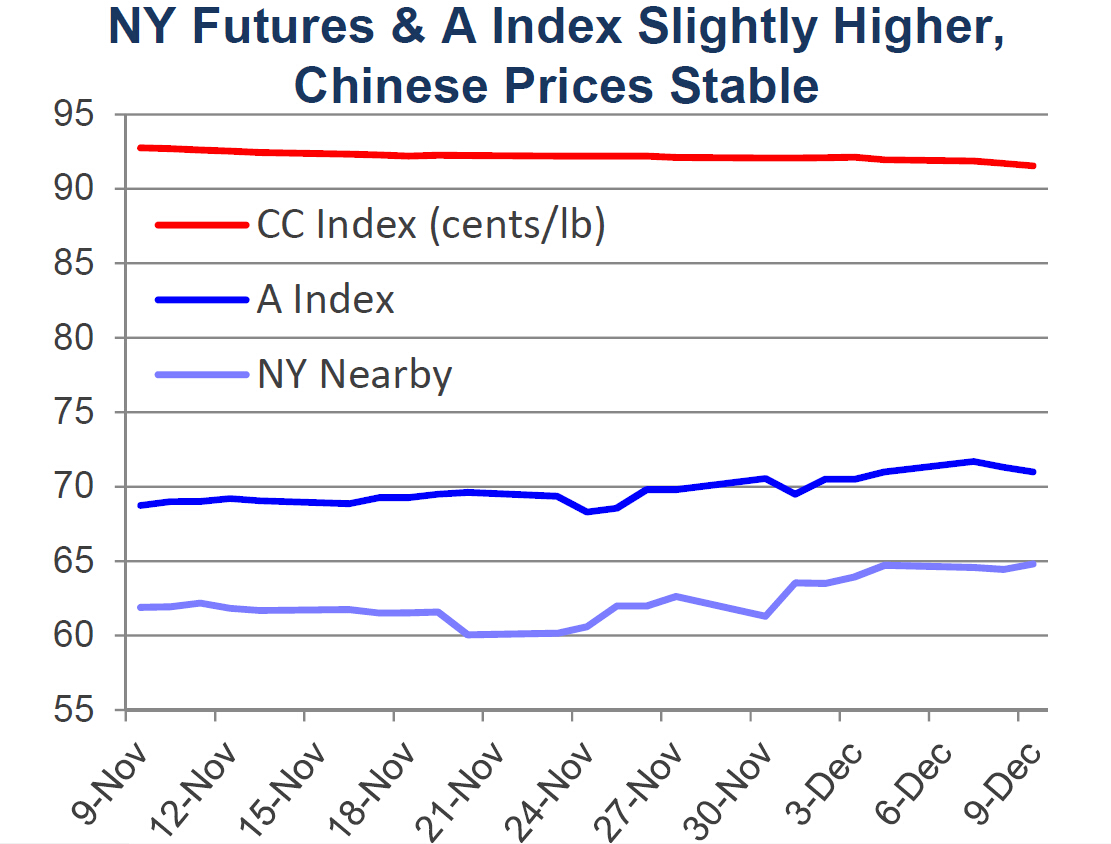
NY futures and the A Index moved slightly higher over the past month, while other benchmark prices were unchanged.
• Prices for the March NY futures contract rose from levels near 62 cents/lb to those over 65 cents/lb.
• The A Index increased from values near 69 cents/lb to those near 71 cents/lb.
• The CC Index was stable in international (92 cents/lb) and local terms (near 12,950 RMB/ton).
• Indian prices held to values near 62 cents/lb in international terms, but increased slightly in local terms, rising 32,000 to 32,800 INR/candy.
• Cotton prices in Pakistan were flat in both international and local terms, with values holding near 61 cents/lb or 5,200 PKR/maund.
Supply, demand, & trade
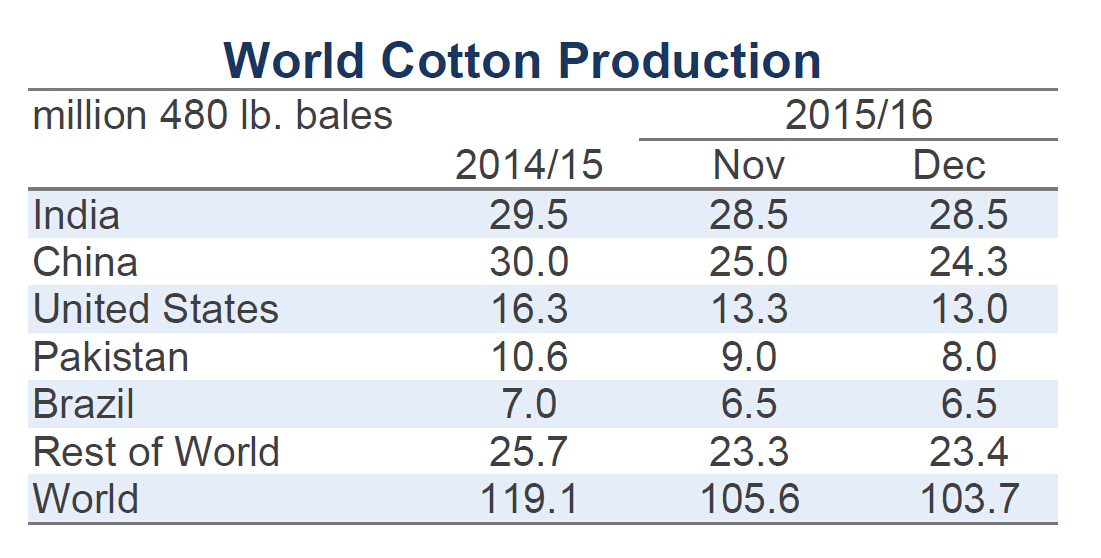
This month’s USDA report featured decreases to forecasts for 2015/16 world cotton production and consumption figures. The reduction to the global production figure was a significant 1.9 million bale decrease (from 105.6 to 103.7 million). This revision suggests that the 2015/16 crop will be just marginally above the recent low set in 2009/10 (103.4 million bales). The global mill-use estimate was lowered by 200,000 bales (from 111.6 to 111.4 million).
At the country-level, changes to production forecasts were widespread. The largest decreases were for Pakistan (-1.0 million bales, to 8.0 million), China (-700,000, to 24.3 million), the U.S. (-250,000, to 13.0 million), Turkey (-150,000, to 2.7 million), Turkmenistan (-125,000, to 1.4 million), and Greece (-100,000 to 0.9 million). These declines were partially offset by a 300,000 bale increase to the Australian figure (+300,000 bales, to 2.4 million).
Country-level decreases to mill-use figures were primarily for China (-500,000 bales, to 32.5 million), India (-200,000, to 25.3 million), and Pakistan (-150,000, to 10.1 million). These declines were partially offset by additions to estimates for Vietnam (+450,000, to 5.1 million) and Bangladesh (+200,000, to 5.9 million).
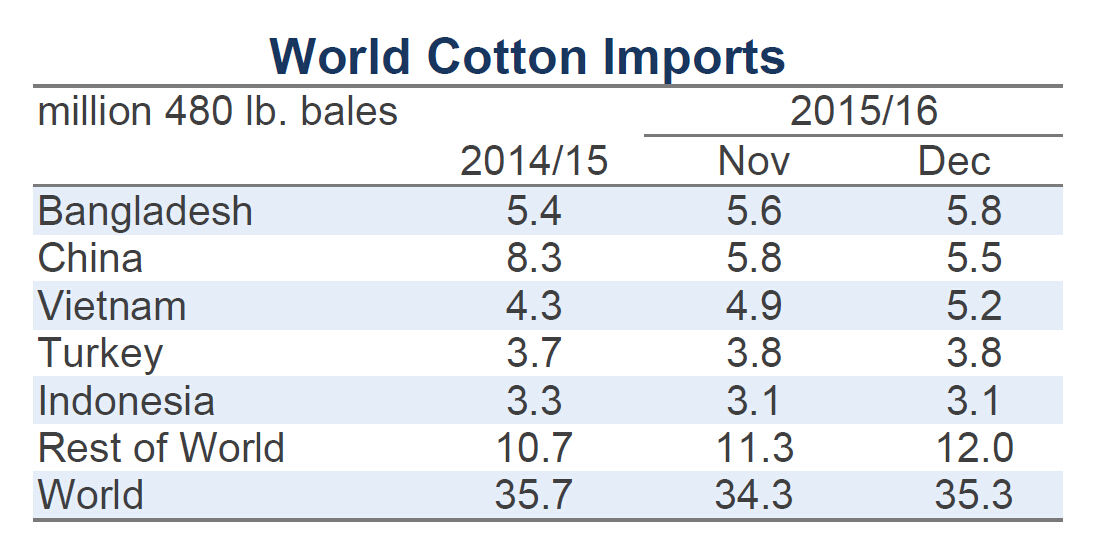
Cotton trade figures were revised higher, primarily as a result of higher import projections for Pakistan (+700,000 bales, to 2.0 million), Vietnam (+350,000, to 5.2 million), and Bangladesh (+200,000, to 5.8 million). For Pakistan, the increase in import expectations was a result of the lower production forecast, where seed cotton arrivals have been slow and there have been yield-based concerns stemming from adverse weather conditions and pest infestations. For both Vietnam and Bangladesh, countries without significant cotton production, the increases in imports are a reflection of growth in spinning in those countries.
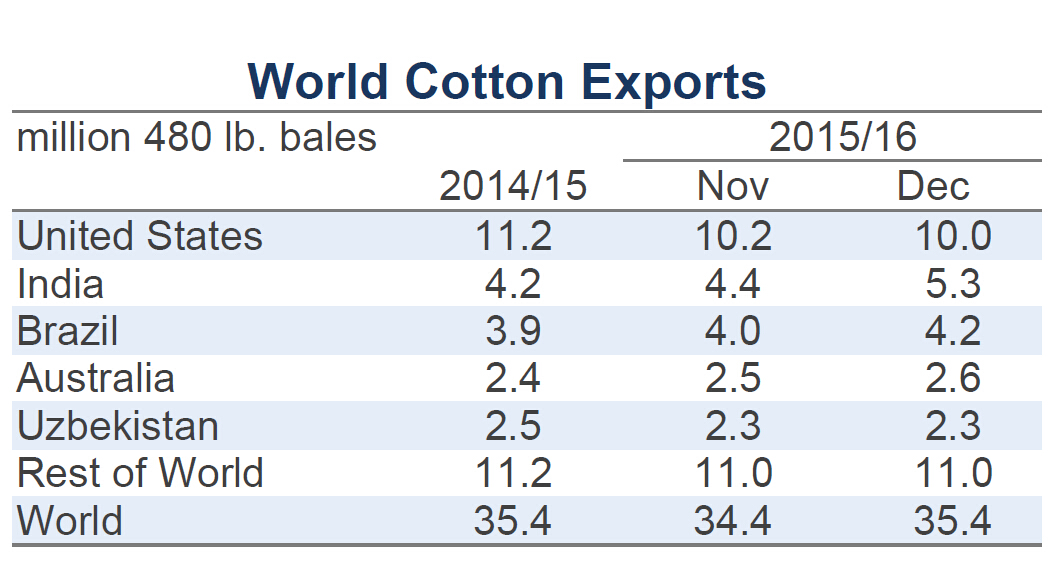
In terms of exports, the largest revisions included a 900,000 bale increase to the projection for India (to 5.3 million), which is expected to capture most the rise in import demand from Pakistan and Bangladesh. Other important changes to export numbers included the 200,000 bale increase for Brazil (to 4.2. million), the 100,000 bale increase for Australia (2.6. million), the 100,000 bale decrease for Greece (to 0.9 million), and the 200,000 decrease for the U.S. (to 10.0. million).
Price outlook
USDA forecasts for both production and consumption have been steadily lowered since the initial set of projections was released in May. The initial forecast for world production was 111.3 million bales and the current estimate is 103.7 million (a decline of 7.7 million). The initial forecast for world mill-use was 115.5 million bales and the current estimate is 111.4 million (a decline of 4.1 million).
The largest country-level reductions for both harvest and consumption figures have been for China. Since May, the USDA forecast for Chinese production fell from 27.0 to 24.3 million (a decline of 2.7 million bales) and the forecast for Chinese mill-use fell from 36.0 to 32.5 million (a decline of 3.5 million). This season’s reductions to Chinese figures emphasize how China has been a challenging market for cotton in recent years.
Relative to peak in 2007/08, Chinese production in 2015/16 is down by more than a third. The steep 5.7 million bale decrease this crop year (from 30.0 to 24.3 million), allowed India (28.5 million) to surpass China as the world’s top producer, a title that China had held without interruption for three decades.
China remains the world’s largest spinner of cotton, but Chinese mill-use has also suffered steep declines after peaking during the 2007/08 crop year (51.0 million bales). Since that time, Chinese consumption has also decreased by more than a third (32.5 million in 2015/16).
Lower levels of Chinese consumption can be expected to slow the process of drawing down Chinese stocks. With statements from Chinese officials indicating that the reduction in reserve supplies would involve lower levels of import quota, an implication for the global market is that Chinese import demand could be expected to remain at lower levels for several years. Following this month’s revisions, China is expected to import only about one fifth of the cotton it brought into the country in 2011/12 (24.5 million bales) and it is predicted that Bangladesh will surpass China as the world’s biggest importer.
This crop year, higher import volumes from Pakistan, Vietnam, and Bangladesh will help offset some of decline from China. However, the pullback in import demand from what has been the world’s dominant cotton buyer can be expected to hold international cotton trade volumes at lower levels, and therefore maintain some downward pressure on prices.