Since the second half of 2012, China��s filament weaving enterprises have been stepping out of the complicated economic panic suddenly suffered from the beginning of last year, and transferring to a relatively stable adjustment period gradually. This article is to give a detailed analysis of the status quo of China filament weaving industry during the first three quarters of 2012.
Production & operation: no improvement in industrial economy
l Zero growth of output for the first time, significant differences among the clusters
Chart 1 Output of China��s Main Filament Weaving Industrial Clusters (First 3Qs of 2012)
|
Name of Clusters |
Unit |
Chemical fiber filament weaving output |
Y/Y (%) |
|
Shengze |
Billion meters |
5.837 |
-8.09 |
|
Changxing |
Billion meters |
4.057 |
9.41 |
|
Xiuzhou |
Billion meters |
2.289 |
-1.00 |
|
Longhu |
Billion meters |
2.028 |
10.00 |
|
Total |
Billion meters |
14.21 |
-0.03 |
(Source: each industrial cluster)
During the first nine months of 2012, China��s main chemical fiber filament weaving industrial clusters, including Shengze, Changxing, Xiuzhou, and Longhu, totally saw an output of 14.21 billion meters of weaving cloth, a year-on-year decline of 0.03%. Specifically, influenced by the market as well as the coming of winter, the silk-like products were not popular any longer in Shengze, and chemical fiber filament weaving output suffered a significant decrease of -8.09% year on year. There was no reduction in Changxin where a growth rate of 9.41% was maintained because its products were mainly popular ones. The output in Xiuzhou was almost the same with the same period of the previous year owing to the weak growth influenced by the local economic policy environment. However, Longhu enjoyed a relatively good growth thanks to its fine-denier and high-density thin fabric (such fabrics are mainly used in the production of outdoor, cold-proof clothing) which was welcomed by the market. (Chart 1)
l More pressures of sales and inventory
According to the data from National Bureau of Statistics of China, nationally, China's above-designated chemical fiber weaving processing enterprises saw a total output value of 89.139 billion yuan in September of 2012, an increase of 7.34% year on year. The rate of production and marketing dropped 1.8 percentage points year on year to 96.43%. The domestic sales ratio was still as high as 88.2% though the sales pressure was not eased.
China chemical fiber filament weaving industry inventory of finished goods from January to September totaled 7.276 billion yuan, an increase of 19.06% year on year. According to the National Bureau of Statistics of China, the inventory of finished goods in 2012 was always at a higher level compared with the year of 2011. The zero growth of finished goods inventory could not change the continuous growing inventory.
l Business adjustment owing to unremarkable indicators
According to the National Bureau of Statistics of China, China chemical fiber weaving manufacturing industry saw total main business income of 85.292 billion yuan in September of 2012 with a year-on-year increase of 3.91%. The gross profit totaled 3.765 billion yuan, growing 6.59% year on year; profit margin was 4.46%, increasing 0.11 percentage point year on year; the percentage of industry suffering losses was 11.45% and the loss of loss-making enterprises grew 80.17% year on year.
Since March last year, chemical fiber filament weaving industry main business income had suffered a declined growth rate for five consecutive months, which showed somewhat rising until last September. The total profit growth rate had decreased for four consecutive months since last May with a slight rebound in September. However, the profit margin had presented a slight rising for six consecutive months since March, while September saw somewhat declining.
Till September, the percentage of China's chemical fiber filament weaving industry suffering losses has been falling slightly for seven consecutive months to 11.45%, while the amount of loss of growth rate has also experienced a rapid decline to 80.17% from 114.39% in June.
This indicates that the enterprises have been able to take the initiative to reduce production and control inventory in face of the unprosperous market sales. Although there were great pressures, they focused on their own management to cut down costs and improve operation efficiency in order for the enterprises�� adjustment as well as the normal production and operation.
Overseas market: weak external demand
l Growing export value & alarmingly export environment
From January to September, China��s textile fabric saw a total export of 22.936 billion C with a year-on-year decrease of 2.04%. Specifically, cotton fabric accounted 9.154 billion USD, falling 6.1% year on year, while chemical fiber filament fabric totally exported 7.403 billion USD, rising 6.6% year on year. According to the export volume, the latter is still the only one that maintains growing export volume among China��s various textile fabrics.
Even so, China's chemical fiber filament fabric showed a decreasing trend in its monthly exports after May, and the growth rate was gradually declining. Exports of cotton fabric was not ideal either, the monthly export volume presented a continuous declining, for which the cumulative exports could not be able to break through the negative growth. This shows that there is no significant improvement in external demand.
l No significant signs of revival in export market
Chart 2 Exports of China��s Chemical Fiber Filament Fabric to the Principal Trade Partners (First 3Qs of 2012)
|
Nation |
Total volume |
Y/Y in volume |
Total value |
Y/Y in value |
Average price |
Y/Y in price |
|
European Union |
5.96 |
-3.35 |
7.21 |
4.65 |
1.21 |
8.28 |
|
Brazil |
4.61 |
0.76 |
3.87 |
4.99 |
0.84 |
4.20 |
|
The United Arab Emirates |
4.50 |
-11.69 |
6.51 |
5.53 |
1.45 |
19.50 |
|
Indonesia |
3.50 |
13.43 |
3.44 |
22.02 |
0.98 |
7.57 |
|
Vietnam |
3.29 |
6.86 |
3.73 |
15.19 |
1.13 |
7.80 |
|
Russia |
3.03 |
-0.05 |
2.83 |
11.45 |
0.93 |
11.50 |
|
Mexico |
2.43 |
-4.73 |
1.82 |
-0.96 |
0.75 |
3.96 |
|
Saudi Arabia |
2.17 |
2.36 |
2.53 |
16.39 |
1.16 |
13.71 |
|
U.S.A. |
1.98 |
21.77 |
2.16 |
16.41 |
1.09 |
-4.40 |
|
Malaysia |
1.87 |
33.72 |
1.96 |
40.07 |
1.04 |
4.75 |
|
Total |
71.25 |
0.09 |
73.99 |
6.65 |
1.04 |
6.12 |
(Source: China Customs)
According to the principal trade partners, the exports of China chemical fiber filament fabric to various major trade areas were not significantly improved. Specifically speaking, the exports to Indonesia and Vietnam presented a respective year-on-year growth of 22.02% and 15.19% based on the steady growth in both volume and value. The exports to Saudi Arabia mainly relied on the rising price with export value growing 16.39% year on year. While the exports to the United States mainly depended on the growing quantity so that the export value saw a year-on-year growth of 16.41%. In addition, the exports to Malaysia witnessed a significant increase in volume with a year-on-year rising of 33.72%, and the export value grew 40.07% year on year. But all in all, there was not an obvious overall growth trend, and the two major markets of European Union and the United Arab Emirates were still in a negative growth.
Fortunately, the United States�� import volume of filament fabric grew 22.96% year on year during the first nine months, in which the imports from China grew 51.85% year on year which makes Chinese products accounted for 54.47% in the total that the United States imported, an increase of 18.6 percentage points year on year. It is noteworthy that although there was no large volume of imports from Canada and Japan, the price was three times Chinese products. How to increase the added value of China's chemical fiber filament fabric to win a space in the international high-end market is a goal in the near future.
l Nylon filament fabric exports maintain increases both in volume and value
China's polyester filament fabric saw a total export of 6.23 billion meters during the first nine months of the previous year, a 0.89% decline year on year, which did not get rid of negative growth. While nylon filament fabrics exported a total of 161 million meters, a year-on-year growth of 6.1%, which was 1.21 USD/m thanks to the rising price by 19.8%. Therefore, the export value grew by 27.38% year on year.
l Continuous declining of filament fabric import volume
China��s filament fabrics imported a total of 873 million meters in the first nine months of 2012, down by 10.62% year on year, while the import value saw a 5.49% falling year on year to 1.532 billion USD. Influenced by the sluggish exports, China's chemical fiber filament fabric witnessed a high domestic sales rate of 88%, thus the domestic market was almost saturated with significantly decreased demand for overseas goods.
Domestic market: fluctuated market confidence for the price downturn
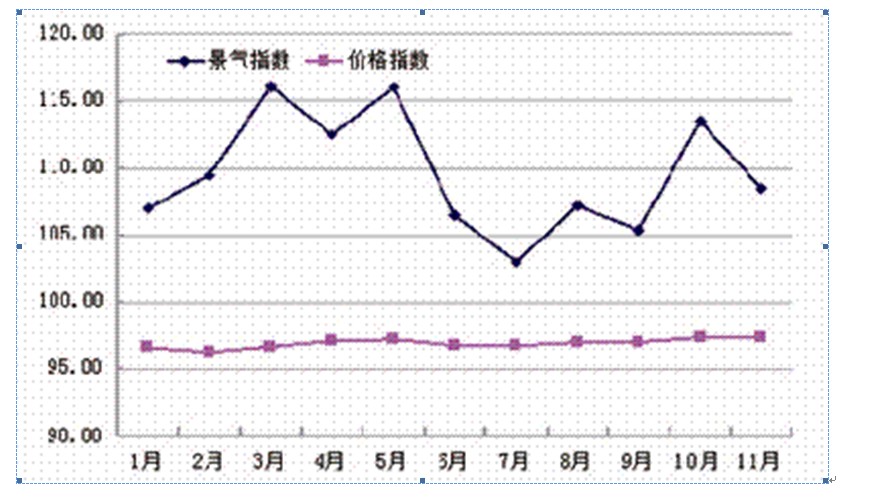
Fig. 1 Confidence and Price Index of Chemical Fiber Filament Fabric, 1-11, 2012
According to Figure 1, the domestic price of chemical fiber filament fabric was very stable last year; however, this is not based on a balanced supply and demand but a kind of stability that the product prices were low to the cost after the supply exceeded the demand which was brought from extremely weak demand. Therefore, this kind of stability is a manifestation of a weak market. In spite of this, enterprises, in face of the desolate market, still expected much of it, but confidence is easily affected by external environment, so that the confidence index of the year presented big fluctuations.
Raw material market: filament fabric��s market space based on cotton price
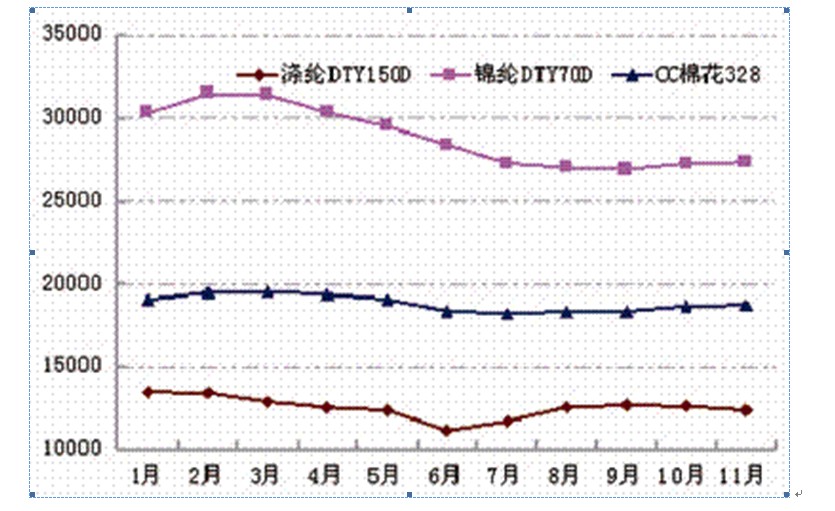
Fig. 2 Price Index of Chemical Fiber Filament Fabric and Cotton, 1-11, 2012
Figure 2 shows that the raw material price performance was also very dull last year. Domestic cotton price was difficult to rise affected by the weak demand of domestic and international markets; however, there were no overly glides thanks to the domestic policy support, which basically maintained at 18,000 �C 19,000 yuan / ton. The price difference of 5,000 yuan / ton between the domestic and international cotton prices deprived the domestic cotton products of their export price advantages and they were forced all the way down.
In this case, cotton products would be gathered for sale in domestic market, but there was no obvious price adjustments based on the support of raw material costs. From the raw material price point of view, chemical fiber filament prices would not rise sharply owing to the weak recovery of the world economy, limited space of oil price rising, and the hopeless expectation of cotton price to the market.
For the chemical fiber filament weaving industry it is mingled hope and fear.
The hope means that the steady raw material prices maintained the price competitiveness of their products, and the cotton fabrics that are lack of international price competitiveness made some market space for chemical fiber filament fabrics. Although the competition between the products of two kinds of raw materials was more intense in China, cotton fabrics were always lack of price advantages. As the domestic economic environment has not been improved significantly, domestic consumers are still keen on cheaper products. Therefore, chemical fiber filament fabric can win market to a certain extent in china.
But the concern is that it does not always go on for long to win market through low prices. Chemical fiber filament fabrics should pay attention to the improvement of the added value of products to give consumers more close intimate consumption feeling, which can win consumers from the product quality and then fundamentally occupy the market.